Ladda ner presentationen
Presentation laddar. Vänta.

4
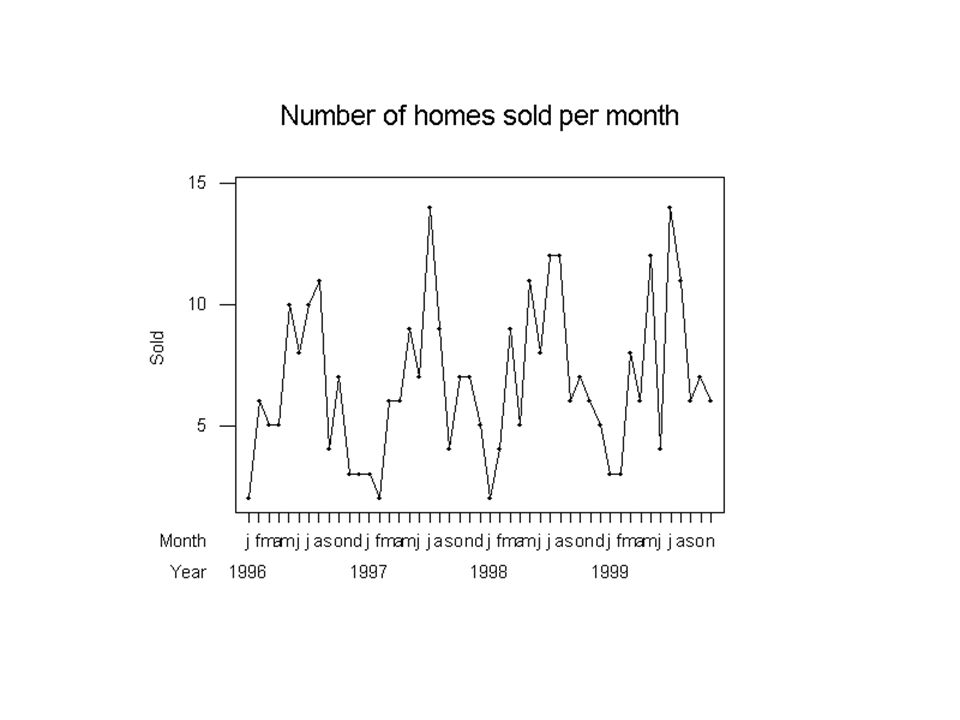
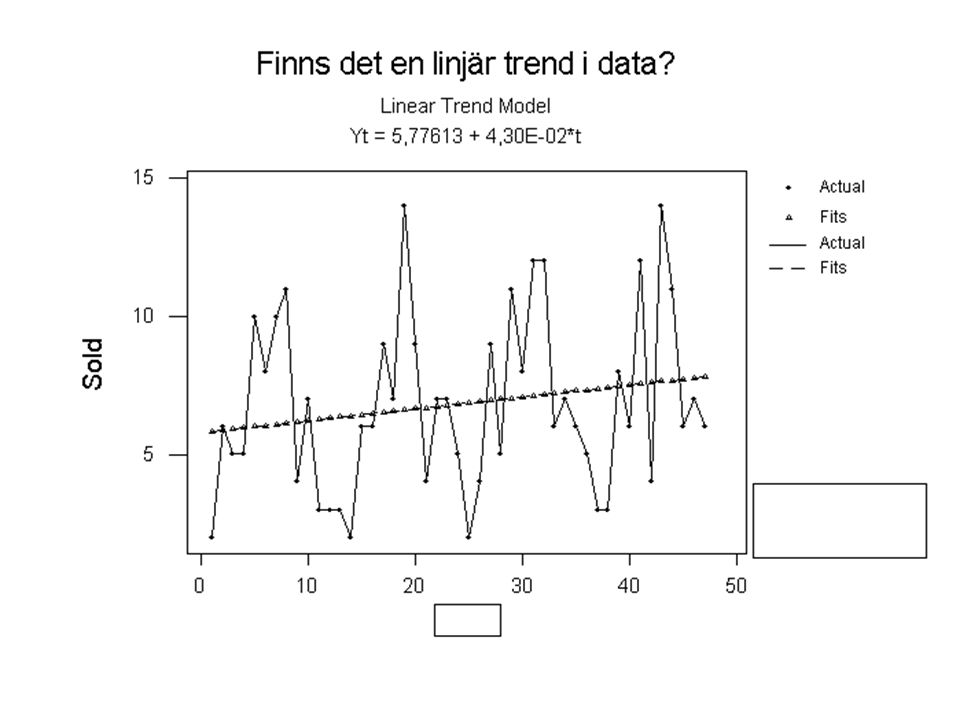
Regression Analysis The regression equation is Sold = 5,78 + 0,0430 time Predictor Coef StDev T P Constant 5,7761 0,9429 6,13 0,000 time 0,04302 0,03420 1,26 0,215 S = 3,181 R-Sq = 3,4% R-Sq(adj) = 1,2% Analysis of Variance Source DF SS MS F P Regression 1 16,00 16,00 1,58 0,215 Residual Error 45 455,27 10,12 Total 46 471,28 Tidsserieregression fungerar statistiskt som vanlig regression.
 = 1,2% Analysis of Variance Source DF SS MS F P Regression 1 16,00 16,00 1,58 0,215 Residual Error ,27 10,12 Total ,28 Tidsserieregression fungerar statistiskt som vanlig regression.")
5
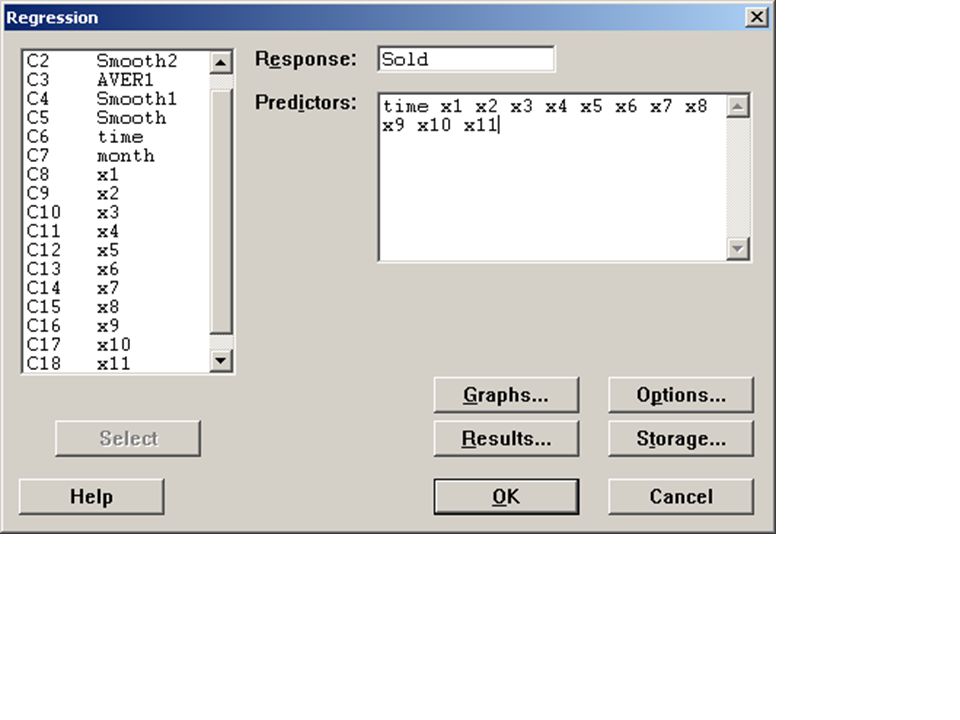
sold time month x 1 x 2 x 3 x 4 x 5 x 6 x 7 x 8 x 9 x 10 x 11 2 1 1 1 0 0 0 0 0 0 0 0 0 0 6 2 2 0 1 0 0 0 0 0 0 0 0 0 5 3 3 0 0 1 0 0 0 0 0 0 0 0 5 4 4 0 0 0 1 0 0 0 0 0 0 0 10 5 5 0 0 0 0 1 0 0 0 0 0 0 8 6 6 0 0 0 0 0 1 0 0 0 0 0.............. 7 46 10 0 0 0 0 0 0 0 0 0 1 0 6 47 11 0 0 0 0 0 0 0 0 0 0 1 3 48 12 0 0 0 0 0 0 0 0 0 0 0

7
Regression Analysis The regression equation is Sold = 3,65 + 0,0285 time - 1,69 x1 - 0,47 x2 + 2,75 x3 + 1,22 x4 + 6,20 x5 + 2,42 x6 + 8,14 x7 + 6,36 x8 + 0,58 x9 + 2,55 x10 + 1,02 x11 Predictor Coef StDev T P Constant 3,6491 0,8526 4,28 0,000 time 0,02851 0,01481 1,92 0,063 x1 -1,691 1,028 -1,65 0,109 x2 -0,469 1,027 -0,46 0,651 x3 2,752 1,026 2,68 0,011 x4 1,224 1,026 1,19 0,241 x5 6,195 1,025 6,04 0,000 x6 2,417 1,025 2,36 0,024 x7 8,138 1,025 7,94 0,000 x8 6,360 1,026 6,20 0,000 x9 0,581 1,026 0,57 0,575 x10 2,553 1,027 2,49 0,018 x11 1,024 1,028 1,00 0,326 S = 1,342 R-Sq = 87,0% R-Sq(adj) = 82,4% Analysis of Variance Source DF SS MS F P Regression 12 410,031 34,169 18,97 0,000 Residual Error 34 61,246 1,801 Total 46 471,277
 = 82,4% Analysis of Variance Source DF SS MS F P Regression ,031 34,169 18,97 0,000 Residual Error 34 61,246 1,801 Total ,277")
8
Antagandet om oberoende residualer är ofta inte uppfyllt när det gäller tidsseriedata. Det kan också vara svårt att kolla detta antagande visuellt.

9
Negativ autokorrelation Positiv autokorrelation

Liknande presentationer


>")


 Cai Sveriges.>")

