Ladda ner presentationen
Presentation laddar. Vänta.

1
Kraft och inspiration som syns

2
Nyheterna i SQL Server ”Denali” Business Intelligence

3
Vilka är ni? Controllers? Utvecklare? BI Konsulter? Annat?

4
Vem är jag? Jörgen Hasselgren, jorgen@hno3.se twitter: @hasselbranch Siter: MDX.Nu, hno3.sejorgen@hno3.se Konsult och vd HNO3 Business Intelligence Arbetar med BI arkitektur och bygger lösningar Lärare på AddSkills Undervisar i Analysis Services, Reporting Services, PowerPivot, Excel analys mot kuber, SharePoint BI, Data Mining, Data Warehouse Design, MDX Har arbetat med Business Intelligence/Data Warehouse sedan 1990

5
Demo schema Allmän genomgång om nyheterna Demos Nyheter i PowerPivot, Excel-klienten Business Intelligence Semantic Model Metodik – Nytt effektivt arbetssätt utvecklare/verksamhet tillsammans – Prototypa fram en modell i Excel – Produktionssätta i Visual Studio DAX query språket Self Service Alerting Rapporter i Crescent

6
BI pyramiden Data Mining Traditionell analys (OLAP, Excel m m) Rapportering med många val Operativ rapportering Dash board /Performance Management
 Rapportering med många val Operativ rapportering Dash board /Performance Management")
7
Analysis Services Reporting Services Integration Services Master Data Services SharePoint Scorecards Excel Workbooks PowerPivot Applications SharePoint Search & Dashboards Microsoft Business Intelligence Most widely deployed EIM & BI Platform Most Broadly adopted Productivity & Collaboration Tools Odata Feeds LOB Apps

8
Pervasive Insight: What’s New in Reporting

9
Denali Reporting and Alerting Enabled as SharePoint Shared Service Built-in scale-out for RS Service Apps SharePoint Cross-farm reporting Integrated backup & recovery, ULS logging, PowerShell etc. End User Alerting Defined from within operational or ad-hoc reports Intuitive Alert rules Alerts self-managed through SharePoint Project “Crescent” Highly visual design experience Rich metadata-driven interactivity Presentation-ready at all times Increase efficiencyProactive Intelligence Managed Self Service BI – Corporate BI Empower users

10
Increase Efficiency Reporting Services is now configured and monitored like other SharePoint shared applications. Maximum set of SharePoint IT management capability enabled Lower TCO on IT who can now leverage existing SharePoint skillset and experience.

11
SSRS improv

12
SSRS as a Shared SharePoint Service

13
Admin capabilities

14
Proactive Intelligence Proactive and responsive data monitoring that enables action. Data Alerts help IWs cope with information overload. Intuitive and flexible alert rules customized to each Information Worker.

15
Self Service Alerting – User- defined Report authors control which data is available for alerting Users create alerts directly on the data they see in reports Supports reports created in Report Builder or BI Development Studio (BIDS) Intuitive Alert Rules (greater than, before/after) Easy to use scheduling (weekly, daily, monthly) Relevant data included in Alert Message Source: Data.gov - Data.gov and the Federal Government cannot vouch for the data or analyses derived from these data after the data have been retrieved from Data.gov.
 Intuitive Alert Rules (greater than, before/after) Easy to use scheduling (weekly, daily, monthly) Relevant data included in Alert Message Source: Data.gov - Data.gov and the Federal Government cannot vouch for the data or analyses derived from these data after the data have been retrieved from Data.gov.")
16
Self Service Alerting

17
Self Service Alerting - Management Per site administration reduces IT burden Fine grained authorization Self-managed through SharePoint IT Visibility & Control of user-defined alerts

18
Self-Service Alerting – How it works

19
Empower Users Crescent is an interactive data exploration and visual presentation experience.

20
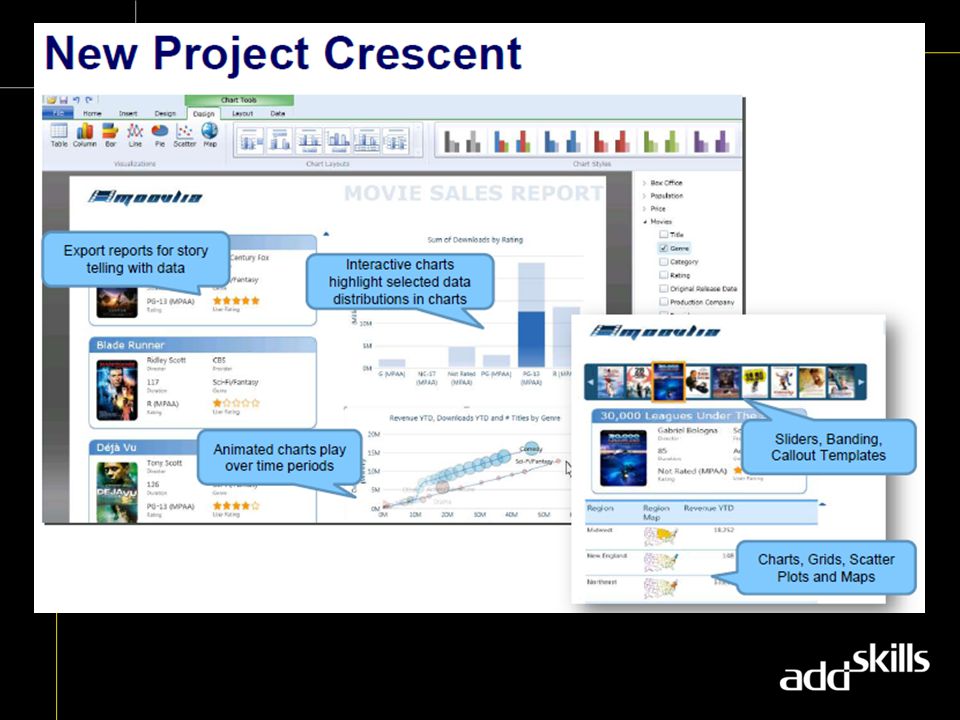
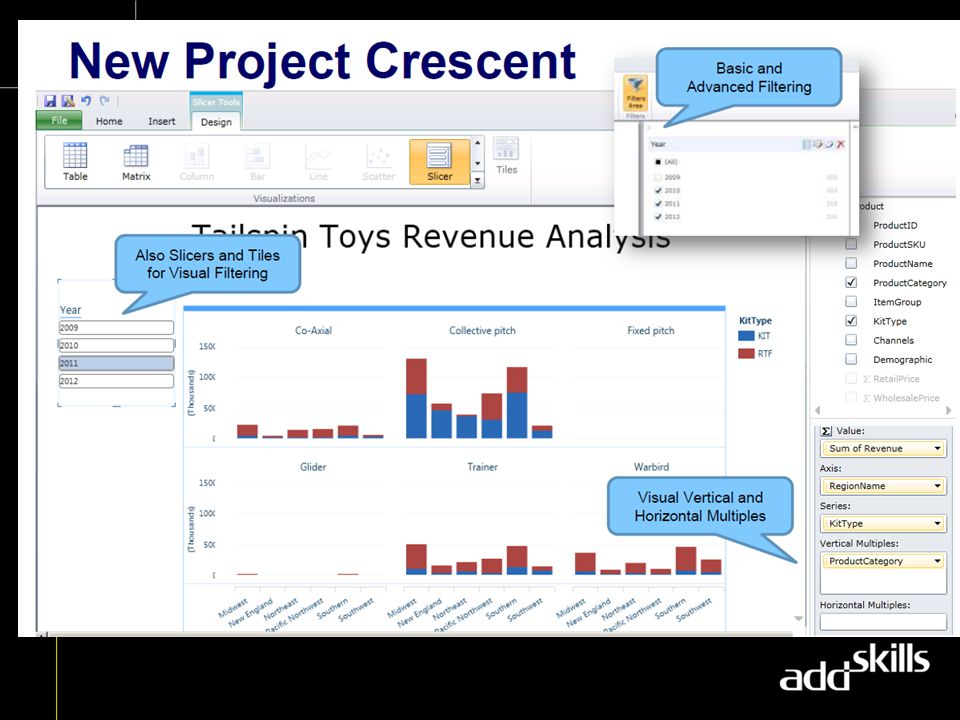
Project Crescent Presentation and story board turn pervasive information into persuasive information Deliver and collaborate through SharePoint Fully integrated with PowerPivot Drive greater insight through smart and powerful querying Zero configuration highlighting and filtering Animated trending and comparisons Interactive, web-based authoring and sharing of information Familiar Microsoft Office design patterns Powerful data layout with banding, callout and small multiples visualizations

21
Highly Visual Design Experience Presentation-ready at all times Rich metadata-driven interactivity Turn pervasive information into persuasive information Deliver and collaborate through SharePoint Interactive at all times Fully integrated with PowerPivot and BISM Drive greater insight through smart and powerful querying Zero configuration highlighting and filtering Animated trending and comparisons Interactive, web-based authoring and sharing of information Familiar Microsoft Office design patterns Powerful data layout with banding, callout and small multiples visualizations

25
Pervasive Insight: What’s New in Analytics?

26
Simplicit y Richness Scalabilit y Bringing Together… PowerPivot + Analysis Services

27
Familiar Interface Simplicity of User Experience Excel for business users, Visual Studio for BI pros Reduced time to deliver solution PowerPivot and BIDS experiences scale from simple apps to the most complex enterprise BI solutions Interactive & Iterative Design Interactive data-driven experience is more intuitive and allows faster iteration in BI application design Visual Studio enables iterative BI app development using source control and seamless deployment to dev/test/prod Business users can share and collaborate with their team by publishing to SharePoint with a single click BI pros can use team development features in VS BI apps are auto refreshed/maintained on the server Sharing & Collaboration

28
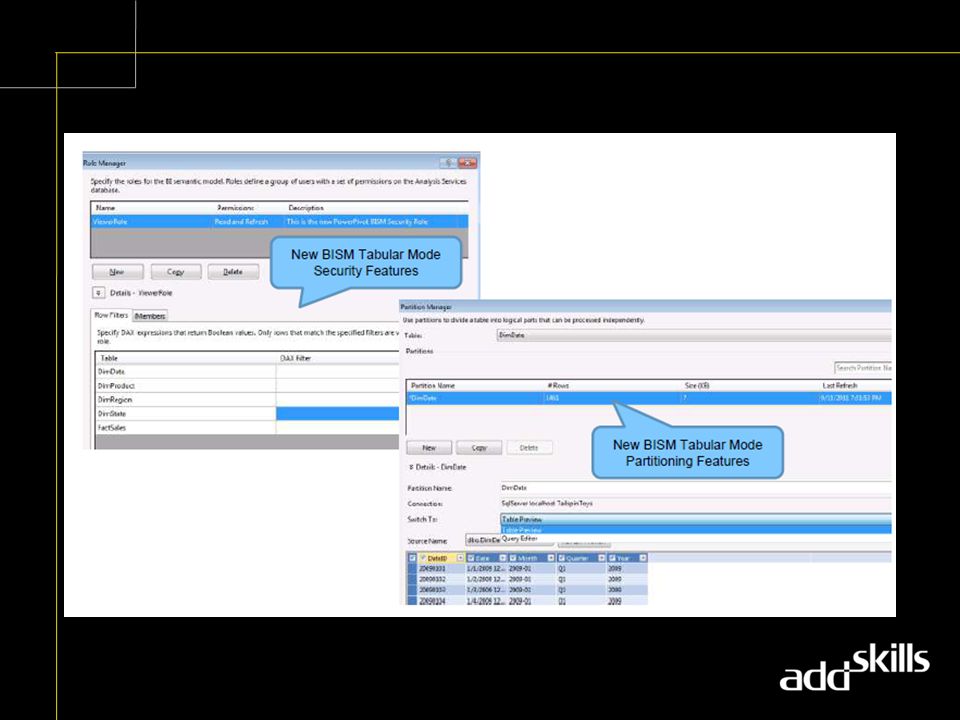
Rich Modeling Capabilities Richness of BI Semantics Multiple relationships, hierarchies Many-to-many, parent-child relationships Key performance indicators, drillthrough, perspectives Rich data types, blobs, images Sophisticated Business Logic Data Analysis Expressions (DAX), Excel formulas, MDX Relational operators (Filter, Aggregate, GroupBy, Lookup) Statistical, time intelligence (YTD, QTD) functions Rank, TopN, VisualTotals, DistinctCount Role-based security model using Active Directory Row and column level security to secure data at the deepest level Fine-Grained Security
, Excel formulas, MDX Relational operators (Filter, Aggregate, GroupBy, Lookup) Statistical, time intelligence (YTD, QTD) functions Rank, TopN, VisualTotals, DistinctCount Role-based security model using Active Directory Row and column level security to secure data at the deepest level Fine-Grained Security")
29
High Performance Scalability & Performance VertiPaq engine – in memory, column oriented store High performance via brute force memory scans No tuning, indexes, aggregates required Optimized for Latest Hardware VertiPaq is optimized for latest x86 and x64 chipsets Designed to exploit cheap memory on latest server h/w Inherently multi-threaded and scales linearly with number of cores Scales from desktops to highest end servers State-of-the-art compression algorithms reduce data volumes by 10x or more Partitioning & paging to support large models Enterprise Scale

30
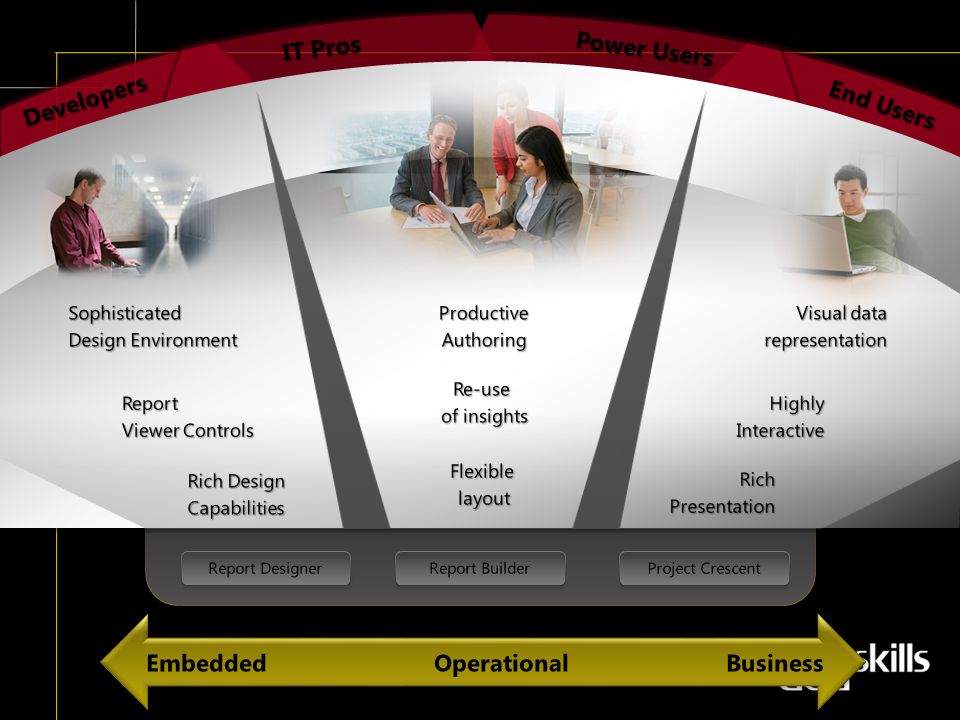
Seamless Transition Across BI Spectrum Team BIOrganizational BI Personal BI PowerPivot For ExcelPowerPivot For SharePointAnalysis Services Our Context BI Solution created by power user. Context is for a small team & it’s managed on a server. My Context BI solution created by user. Context is only for user & exists as document. The Org’s Context BI Solution created by IT, Established corporate context & is reusable, scalable and backed up. Empowered Aligned

31
Consolidated management through SharePoint 2010 Central Administration Portal and PowerShell: Consolidated management through SharePoint 2010 Central Administration Portal and PowerShell: SSRS administration SSRS administration Configuration Configuration Reporting Services End User Alerts: Reporting Services End User Alerts: Customizable by end users for reports published to SharePoint Customizable by end users for reports published to SharePoint Insight into data changes that matter most Insight into data changes that matter most Increases end user productivity Increases end user productivity

32
One Semantic Model for BI BI Semantic Model For reporting, analytics, scorecards, dashboards For all users – Personal, Team, Organization BI Unification of OLAP (UDM) and report (SMDL) models Powerful & Flexible Supports relational and multidimensional APIs Model can be cached (VertiPaq) or passthrough (Realtime) Sophisticated business logic using DAX and MDX Optimized for latest hardware – multi-core, in-memory Supports enterprise grade security and data volumes Professional development and management tools Enterprise Ready
 and report (SMDL) models Powerful & Flexible Supports relational and multidimensional APIs Model can be cached (VertiPaq) or passthrough (Realtime) Sophisticated business logic using DAX and MDX Optimized for latest hardware – multi-core, in-memory Supports enterprise grade security and data volumes Professional development and management tools Enterprise Ready")
33
BI Semantic Model Third-Party BI Applications Reporting Services Reports Excel Workbooks Excel Workbooks PowerPivot Applications PowerPivot Applications SharePoint Dashboards & Scorecards SharePoint Dashboards & Scorecards OdataFeeds Data Model BI Semantics Data Access BI Applications Data Sources RelationalRelationalMultidimensionalMultidimensional DAXDAXMDXMDX VertiPaqVertiPaqRealtimeRealtime BI Semantic Model

34
UDM Improvements & Roadmap Industry leading OLAP engine −Large developer/partner ecosystem −Broad adoption from small businesses to large enterprises Denali addresses top pain points −4GB string store limit −XEvents and monitoring enhancements −Performance, scale, reliability improvements Roadmap −Will continue to make measured investments in UDM and MOLAP technology based on customer & partner feedback −Primary focus going forward will be on BISM and VertiPaq

35
BISM & UDM Coexistence BISM does not replace UDM −Use UDM for complex OLAP applications (budgeting, forecasting, write back, complex calculations) −For everything else, BISM offers a simpler and high performance alternative Existing BI solutions −Stick with UDM… −Consider BISM if you’re planning a major solution upgrade −Migration from UDM to BISM will require some redesign BISM and UDM are available side-by-side −Instance level option
 −For everything else, BISM offers a simpler and high performance alternative Existing BI solutions −Stick with UDM… −Consider BISM if you’re planning a major solution upgrade −Migration from UDM to BISM will require some redesign BISM and UDM are available side-by-side −Instance level option")
36
UDM vs BISM

37
BISM in Visual Studio

39
Analysis Services Architecture Excel Services PowerPivot for SharePoint (Analysis Services) PowerPivot for SharePoint (Analysis Services) Excel Internet Explorer Analysis Services BISM SharePoint Reporting Services Third Party Apps PowerPivot for Excel xlsx Analysis Services UDM xlsx BI Development Studio / Project Juneau Personal BI Team BI Organizational BI Personal BI Team BI Organizational BI
 PowerPivot for SharePoint (Analysis Services) Excel Internet Explorer Analysis Services BISM SharePoint Reporting Services Third Party Apps PowerPivot for Excel xlsx Analysis Services UDM xlsx BI Development Studio / Project Juneau Personal BI Team BI Organizational BI Personal BI Team BI Organizational BI")
40
Master Data Services Data quality Familiar tools Performance Data Quality Services Profiling Cleansing Matching Impact Analysis Lineage tracking with data sources Integration Services Easy data loading

41
Batch Cleansing - Using SSIS Microsoft Confidential—Preliminary Information Subject to Change Reference Data Definition Values/Rules New Records Corrections & Suggestions Correct Records Invalid Records SSIS Data Flow Source + Mappin g Data correction Component SSIS Package Destination Referen ce Data Service s DQS Server

42
Summary RichnessScalability Simplicity Personal BI Organizational BI Familiar tools for business users (Excel 2010) and BI pros (Visual Studio 2010) Intuitive data driven design experience in PowerPivot and BIDS One-click sharing & collab for business users via SharePoint PowerPivot field list in Excel for server side models VertiPaq in-memory engine for high perf by default (no tuning required) State-of-the-art compression algorithms Scales to largest enterprise servers with partitioning and paging Improved robust SharePoint config and performance BI Semantic Model brings together the best of OLAP and report models for business users and BI pros Rich modeling capabilities (hierarchies, parent-child, KPIs, perspectives, etc.) Complex business logic using DAX and MDX Fine grained security (row/column level) Team BI Reporting Analytics Visualization Dashboards Scorecards
 and BI pros (Visual Studio 2010) Intuitive data driven design experience in PowerPivot and BIDS One-click sharing & collab for business users via SharePoint PowerPivot field list in Excel for server side models VertiPaq in-memory engine for high perf by default (no tuning required) State-of-the-art compression algorithms Scales to largest enterprise servers with partitioning and paging Improved robust SharePoint config and performance BI Semantic Model brings together the best of OLAP and report models for business users and BI pros Rich modeling capabilities (hierarchies, parent-child, KPIs, perspectives, etc.) Complex business logic using DAX and MDX Fine grained security (row/column level) Team BI Reporting Analytics Visualization Dashboards Scorecards")
43
Demo schema Allmän genomgång om nyheterna Demos Nyheter i PowerPivot, Excel-klienten Business Intelligence Semantic Model Metodik – Nytt effektivt arbetssätt utvecklare/verksamhet tillsammans – Prototypa fram en modell i Excel – Produktionssätta i Visual Studio DAX query språket Rapporter i Crescent

44
Förra året När passar inte PowerPivot in? När vi vill förenkla med färdiga hierarkier M2M strukturer När KPI:er behövs Komplexa ”upprullningar” i strukturer Komplexa affärsregler som skall behandlas på samma sätt av alla För ”den stora massan” som vi vill standardisera rapporteringen (de kan dock vara mottagare av PowerPivot rapporter) Säkerhetskrav
 Säkerhetskrav.")
45
Nu När passar inte PowerPivot in? När vi vill förenkla med färdiga hierarkier (M2M strukturer) När KPI:er behövs Komplexa ”upprullningar” i strukturer Komplexa affärsregler som skall behandlas på samma sätt av alla För ”den stora massan” som vi vill standardisera rapporteringen (de kan dock vara mottagare av PowerPivot rapporter) Säkerhetskrav
 När KPI:er behövs Komplexa upprullningar i strukturer Komplexa affärsregler som skall behandlas på samma sätt av alla För den stora massan som vi vill standardisera rapporteringen (de kan dock vara mottagare av PowerPivot rapporter) Säkerhetskrav.")
46
Self Service BI För de som behöver, förstår och fått utbildning

47
Hur kommer jag igång? Web sites http://powerpivotgeek.com http://powerpivotpro.com http://powerpivot-info.com Utbildningar http://www.addskills.se/utbildning/kurser/kurser/analysera-data- med-powerpivot/ Programvaror Måste: Excel 2010 Bra att ha: SharePoint 2010

48
Kom igång med Business Intelligence Rekommenderade kurser Implementing and Maintaining Microsoft SQL Server 2008 Analysis Services, M6234, 3 dagar Implementing and Maintaining Microsoft SQL Server 2008 Integration Services, M6235, 4 dagar Implementing and Maintaining Microsoft SQL Server 2008 Reporting Services, M6236, 3 dagar Designing SQL Server 2008 R2 Business Intelligence Solutions, A514, 3 dagar Skapa frågor med Microsoft SQL Server 2008 MDX, A512, 2 dagar Data Mining med Microsoft SQL Server 2008, A511, 2 dagar Kurserna kan ges både som företagskurser och schemalagd utbildning. Kunderna har utsett Addskills till Sveriges bästa Microsoft utbildningspartner, läs mer på addskills.se.

49
Förbered dig för framtiden DAX – Grundkurs. Klar i januari 2012 ”Denali” BI uppgradering januari 2012 ”Denali” DBA uppgradering januari 2012 ”Denali” developer uppgradering januari 2012 Certifieringsförberedande kurser april 2012 Kurserna kan ges både som företagskurser och schemalagd utbildning.

Liknande presentationer


>")


