Ladda ner presentationen
Presentation laddar. Vänta.

1
Fördelarna med att arbeta med en gemensam strategi för luftvård och klimat inom EU Mohammed Belhaj

2
-Vems fördelar? -Individerna i samhället ( hälsa och välfärd) -Ekosystemet (intristic value) (altruism?) Start punkten Effekt av luft föroreningEffekt av Klimat förändring -Hälsa-Havsnivå -Försurning,....-Ökenspridning
 -Ekosystemet (intristic value) (altruism ) Start punkten Effekt av luft föroreningEffekt av Klimat förändring -Hälsa-Havsnivå -Försurning,....-Ökenspridning.")
3
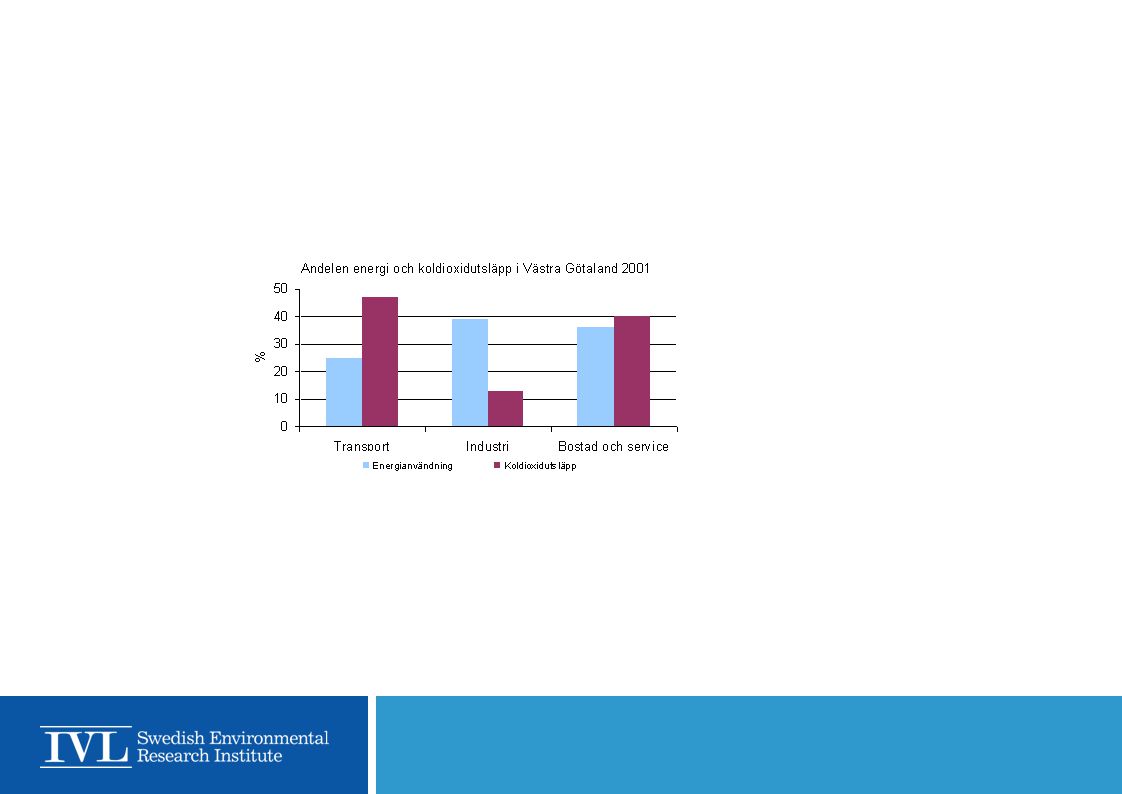
Varför gemensamma åtgärder ( förutom lokala och nationella )? -Gränsöverskridande föroreningar Kräver -Gemensamma åtgärder Countries contributing more than 1% to the deposition of sulphur over the EMEP 150*150 km grid cell (19 20) situated in Västra Götaland. Source: adapted from www.iiasa.ac.at www.iiasa.ac.at Source deposition mg S m-2 Percentag e North Sea58.0614.2 Denmark54.7813.4 Poland44.3710.9 United Kingdom40.429.9 Indeterminate (background)37.69.2 Germany_West31.097.6 Baltic Sea29.937.3 Sweden20.084.9 France9.772.4 Czech Republic9.482.3 Germany_East8.132 Belgium6.521.6 Hungary5.911.5 Ukraine4.911.2
 situated in Västra Götaland. Source: adapted from Source deposition mg S m-2 Percentag e North Sea Denmark Poland United Kingdom Indeterminate (background) Germany_West Baltic Sea Sweden France Czech Republic Germany_East8.132 Belgium Hungary Ukraine")
4
Hur minska föroreningarna (externaliteter)? -Styrmedel 1. Regleringar; 2. Marknadsbaserade; 3. Information. -Fördelar med styrmedel Minska föroreningarna; R&D; Ekonomisk tillväxt. -Nackdelar med styrmedel? Risk att öka produktionskostnader

5
Long-range Transboundary Air Pollution (LRTAP) (Signature 1979; i draft 1983) -Ursprung 60 talet (korrelation mellan S och försurning i Norden) -Stockholm konferens "Human Environment" 1972 -Mellan 1972-1977 (studier bevisar gränsöverskridande föroreningar) Koonventionen förlängdes med 8 specifika protokoller: The 1999 Protocol to Abate Acidification, Eutrophication and Ground-level Ozone; The 1998 Protocol on Persistent Organic Pollutants (POPs); The 1998 Protocol on Heavy Metals; The 1994 Protocol on Further Reduction of Sulphur Emissions; The 1991 Protocol concerning the Control of Emissions of Volatile Organic Compounds or their Transboundary Fluxes; The 1988 Protocol concerning the Control of Nitrogen Oxides or their Transboundary Fluxes; The 1985 Protocol on the Reduction of Sulphur Emissions or their Transboundary Fluxes by at least 30 per cent; The 1984 Protocol on Long-term Financing of the Co-operative Programme for Monitoring and Evaluation of the Long-range Transmission of Air Pollutants in Europe (EMEP); The Gothenburg Protocol The Executive Body adopted the Protocol to Abate Acidification, Eutrophication and Ground-level Ozone in Gothenburg (Sweden) on 30 November 1999. The Protocol sets emission ceilings for 2010 for four pollutants: sulphur, NOX, VOCs and ammonia

6
Effects of pollutants covered by the Convention’s Protocols Pollutant Health effectsEcological effects SO 2 -Respiratory diseases -Respiratory symptoms in asthmatics -Asthma attacks -Acid rain (e.g., damage to fish populations and forest soils) NO X -Lung irritation (e.g., inflammation, respiratory cell damage, premature ageing) -Increased susceptibility to respiratory infection -Respiratory diseases -Asthma attacks -Acid rain (e.g., damage to fish populations and forest soils) -Eutrophication (e.g., disruption of ecosystem functions, acidification of surface and ground waters) -Regional haze VOCs-Lung irritation (e.g., inflammation, respiratory cell damage, premature ageing) -Increased susceptibility to respiratory infection -Asthma attacks -Decreased commercial forest productivity -Damage to ecosystem functions -Regional haze Ammo- nia -Eye and upper respiratory tract irritation -Burning and scarring of tissues -High blood pressure -Lethal at higher concentration (can cause blindness, lung damage, heart attack, death) -Eutrophication (e.g., disruption of natural ecosystems) -Reduction in egg hatching success in fish, reduction in growth rate and morphological development (esp. gills, liver and kidney) -Toxic to fish and aquatic organism at high concentrations.
 -Toxic to fish and aquatic organism at high concentrations..")
7
The Kyoto Protocol: the United Nations Framework Convention on Climate ChangeUnited Nations Framework Convention on Climate Change Kyotoprotokollet, internationell överenskommelse sluten i december 1997 i Kyoto, Japan. Avtalet innebär,december1997KyotoJapan att de årliga globala utsläppen av växthusgaser ska minska med 5,0 procent från året 1990 till perioden 2008-2012.växthusgaser199020082012 Protokollet innebär bland annat att EU ska minska sina utsläpp med 8 procent och Japan med 6 procent. Länderna inom EUEUJapan har sedan förhandlat inbördes och fått olika enskilda kvoter. För att avtalet skulle träda i kraft krävdes det att minst 55 länder som tillsammans svarade för 55 procent av 1990 års utsläpp officiellt ratificerade det.

8
. Environmental taxes in Sweden, 1993-2005 (SEK million, current prices). 1993199520002005* Energy tax39 02943 55152 80765 903 Tax on substances below5786741 5891 218 -Sulphur tax1841578975 -Tax on domestic air transport 196186-- -Tax on insecticides13325878 -Tax on commercial fertilisers 185299357329 -Tax on waste--1 085736 Tax on transportation8 1195 7987 02610 249 Tax on natural resources--125200 Total47 72650 02361 54777 570 Total as percent of GNP3.12.8 2.9 Source: Adapted from Statistics Sweden. *) preliminary figures.
 preliminary figures..")
11
Några länders rankning m.a.p olika energikällor Land RankIndex för alla förnybara Vin d ind ex Sol Ind ex Index för biomassa och andra källor Index för infrastruktur för förnybarenergi Spanien1 (1)7172686180 S Britan.2 (3)7073465566 Tyskland3 (4)6667725560 USA3 (2)66 736070 Frakrike5 (5)5960545051 Italien6 (5)5758564857 Portugal6 (5)5758534759 Grekland8 (8)5658554256 Australia9 (11) 5556604864 Danmark9 (10) 5557444763 Island9 (8)5558344257 Sverige12 (12) 53 425249 Belgien13 (13) 505237 54 Holland14 (13) 4950484357 Norge15 (15) 4849334656 Finland16 (16) 44 335146 Österike17 (17) 3432554750 Källa: Ernst & Young (2004). Som framgår av tabellen betyder högre index att landet är bättre rankad när det gäller användningen av den specifika energikällan.

13
European Commission CO2 source categories identified as key sources (emissions in Gg*) Source categories 19902001% change Level assessment % Energy industries11444341119301-227.2 Transport6950038339252020.3 Other sectors635096655763316.0 Manufacturing industries and construction 642348585160-914.2 Source: Annual European greenhouse gas inventory report 2003. * 1 Gigagram = 1 kiloton http://reports.eea.eu.int/technical_report_2003_95/en/tech_95.pdf

14
Figure: Data on historical and future CO2 levels based on statistics from Eurostat and forecasts made with the PRIME model.(EU-15 energy and transport outlook to 2030). Red curve presents total amount of CO2, dotted red line the Kyoto path and the black line CO2 emissions per capita.

Liknande presentationer