Ladda ner presentationen
Presentation laddar. Vänta.

1
Tillväxtkurvan We need 4 hugs a day for survival.
We need 8 hugs a day for maintenance. We need 12 hugs a day for growth. Virginia Satir

2
Is it possible to have one growth chart for the world, or must we have one growth chart for each country? Maybe growth charts must be even more specific? I will try to address these questions in my speech. The major reason to update growth charts is the secular trend. Most studied populations tend to get taller.

3
Varför nya tillväxtkurvor?
Befolkningens hälsoläge har förbättrats Bakgrund för att bekräfta individs hälsa Uppföljning av politiska mål Nya verktyg att monitorera individs hälsa Öka möjlighet att upptäcka: sensitivitet Vanvård, misshandel, övergrepp Akuta och kroniska sjukdomar When making all these decision, the first question is what the purpose of the growth chart is. Is it to be used just to confirm health or to find disturbances in growth caused by abuse or chronic disorders? These different tasks set the demands. If we select data that reflects the growth of all children, we will just get a very rough estimate that an individual child seems to grow like most others. However, it is of great importance to have these data to follow socioeconomic conditions. On the other hand, if we want a tool for health monitoring that is good enough to identify abnormal growth, we need a chart that represents the optimal growth for the well off health child. Then it will be possible to reach an acceptable sensitivity to detect child abuse or chronic disorders.

4
Agenda Vad är optimal tillväxt
Vilken population Baserat på socioekonomi? På hälsostatus? Alla? Faktorer som påverkar tillväxt individuellt Mendelsk ärftlighet Epigenetik? Kända variationer inom normal tillväxt Preterm Bröst- eller flaskuppfödd? Maturation

6
Parental education (y)
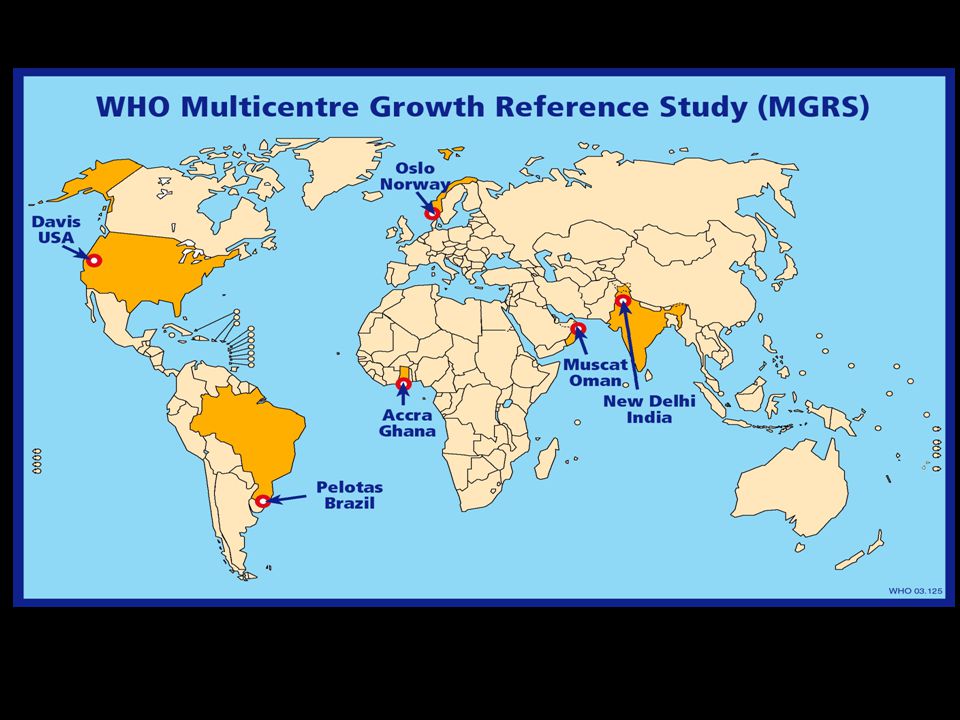
WHO Multicentre Growth Reference Study

7
Mean length from birth to 24 months for the six MGRS sites
Age (days) Mean of Length (cm) 200 400 600 50 60 70 80 Brazil Ghana India Norway Oman USA WHO Multicentre Growth Reference Study Group. Assessment of linear growth differences among populations in the WHO Multicentre Growth Reference Study. Acta Paediatr Suppl 2006;450:56-65.
 Mean of Length (cm) Brazil. Ghana. India. Norway. Oman. USA. WHO Multicentre Growth Reference Study Group. Assessment of linear growth differences among populations in the WHO Multicentre Growth Reference Study. Acta Paediatr Suppl 2006;450:")
8
Adapted from: Neyzi O et al. Acta Paediatr. 2006 Dec;95(12):1635-41.
Children of all races will grow in a similar way if they only live under similar condition. This recent study of Turkish children, here boys, compares the growth pattern with US standard. Children from high socioeconomic conditions born in the 50ies grew like the children of today until 12 years of age but then lost in height while children with low socioeconomic condition grew much worse than those in the 50ies. Adapted from: Neyzi O et al. Acta Paediatr Dec;95(12):
:")
9
Polska kvinnor And what about siblings? Children tend to become taller if their mothers have children born before them. In this Polish study, the girls were taller in families with many children. They also had higher BMI. Laska-Mierzejewska T & Olszewska E. J Biosoc Sci Mar;38(2):
:")
10
Power C et al. BMJ. 2002 Jul 20;325(7356):131-4.
It is clear that socioeconomic factors have impact on growth. Here, we see final height in more than men in the UK born 1958 and its relation to their socioeconomic background, where the situation in early childhood was of more importance than how thy ended up at 33 years of age. Power C et al. BMJ Jul 20;325(7356):131-4.
:")
11
Werner B & Bodin L. Acta Paediatr. 2006 May;95(5):600-13.
But of course, there are differences between countries. Here, children in the latest Swedish growth study are compared to other populations. You can see the marked difference especially in relation to children growing up in Cuba. Werner B & Bodin L. Acta Paediatr May;95(5):
:")
12
Karlberg J, Jalil F, Lindblad BS.
Acta Paediatr Scand May;77(3):
:")
13
ICP Puberty Pubertetsfasen Childhood Barndomsfasen Infancy
Spädbarnsfasen Why is growth so complicated? The growth of a child seems at first to follow a straight line, but it is possible to divide this to three growth phases: infancy, childhood and puberty. The timing of these growth phases may vary between children, both related to inheritance and to events that affects the child. ICP Karlberg, J. Acta Paediatr Scand Suppl. 1989;350:70-94.

14
Infacy, childhood, puberty model
Karlberg J. Acta Paediatr Scand Suppl. 1989;356:26-37.

15
The question is, when a optimal growth chart is created, if it is expected that individual children grows according to the chart? An easy was to see this is by making the curves of the growth chart info straight lines representing the mean and variation.

16
Kanalisering In conclusion, many children do not grow parallel to a channel in the chart. It is however, possible, to evaluate if many deviations from the canalization are normal or not. 0-24 mån

17
Hermanussen M et al. Eur J Pediatr. 2001 Mar;160(3):163-7.
70% Here, you can see individual children from the Zurich longitudinal growth study. If the growth chart would be perfect, most children would grow on a line parallel to then SD-scores. But do they? Actually 70 % has a deviation of more than 1 SD. So what's the conclusion? Are growth charts useless? Really not. 70 % will end up where they started in SD scores. In addition, we can explain much of variation that is seen. One obvious reason is the biological tempo, i.e. the timing of puberty. Here you se a child with late maturation and one with early maturation. 70% Hermanussen M et al. Eur J Pediatr Mar;160(3):163-7.
:")
18
Anpassad från Ljung BO et al. Ann Hum Biol. 1974 Jul;1(3):245-56
Sekulär trend menarke But the secular trend is not just about height. Like in many other countries puberty occurs at earlier ages, as here age for menarche in Swedish girls. Anpassad från Ljung BO et al. Ann Hum Biol Jul;1(3):245-56
:")
19
Snabbare Högre topp Tidigare adolescens
So, the secular trend in growth clearly affects both the height velocity and the time it takes for a child to reach final height, i.e. to reach a higher final height when puberty starts earlier demands that the child grows faster. Liu YX, Wikland KA, Karlberg J. 2000

20
Height velocity (cm/y)
Already Jim Tanner, showed that no child will grow according to a firm growth chart during puberty. Actually, is would be clearly pathological if a child followed the smoothed growth curve that will be the result when puberty occurring at different ages is fitted into one line – here the dotted one. Age (year) Marshall WA, Tanner JM. Arch Dis Child Feb;45(239):13-23.
 Marshall WA, Tanner JM. Arch Dis Child Feb;45(239):")
21
Karlberg et al. Horm Res 2003;60(suppl 1):27–35
Further, the pubertal growth will be larger if it starts early. Here, you can see than a girl with onset of puberty at age 10 will have about 27 cm left to grow. If she matures late, with pubertal onset at 12 years she will grow about 5 cm less during puberty. The boy would grow 35 cm with start at age 10 and 32 cm at age 12. Karlberg et al. Horm Res 2003;60(suppl 1):27–35
:27–35.")
22
Karlberg et al. Horm Res 2003;60(suppl 1):27–35
But growth patterns related to maturation are different already before puberty. Here you see that boys with late maturation grow slower before puberty, but as a group ends up taller when they reach final height. Karlberg et al. Horm Res 2003;60(suppl 1):27–35
:27–35.")
23
Prematuritet Syndron & sjukdom Socioekonomi Enicitet Hög höjd
Uppfödning Statistik Out layers Normalitet Linearitet So if we wish to have a growth chart that reflects how children are growing today, we must keep updating the charts. Here you se the growth of a single girl, with an expected longitudinal growth pattern. Shall we then just investigate how tall children are in different ages today, i.e. make a cross-sectional study. If we do, we actually loses the possibility to predict how tall the 5 year old of today, will be as adult. To have this possibility we need a longitudinal study, but then we loses the possibility to compare the child with the population growing up right now, since the studied population must have reached final height. Here we have the longitudinal height of a population of girls. Several decisions must be made if we want to use their growth in a growth chart. What about preterm children? Shall we exclude children with some disorders? Shall we make selections based on socioeconomic backgrounds, on race or geographic areas or at what altitude the child grew up? Shall we only select breastfed children?

24
Karlberg J et al. Acta Paediatr Scand. 1988 Jul;77(4):516-24.
Delayed infancy Height (cm) Stunted One example is delaying of infancy, which may occur when children suffers from chronic infectious diarrhea, celiac disease or growth hormone deficiency. Age (years) Karlberg J et al. Acta Paediatr Scand Jul;77(4):
 Stunted. One example is delaying of infancy, which may occur when children suffers from chronic infectious diarrhea, celiac disease or growth hormone deficiency. Age (years) Karlberg J et al. Acta Paediatr Scand Jul;77(4):")
25
Stunting i Pakistan Karlberg J, Jalil F, Lindblad BS.
Acta Paediatr Scand May;77(3):
:")
26
Liu Y et al. Pediatr Res. 2000 Apr;47(4 Pt 1):475-80
And must we evaluate each growth pattern. Although this curve represents how the stunting process accelerated during the collapse of the Soviet union, 10 % of children in the Swedish growth study born 1974, were stunted. Leonard WR et al. 1: Hum Biol Apr;74(2):
:")
27
Luo ZC et al. Epidemiology. 2003 Jan;14(1):65-73
= Tidig pubertet So, in many children, it is possible to predict if the child will mature early or late. Luo ZC et al. Epidemiology Jan;14(1):65-73
:")
28
Hagenäs L & Gelander L. Kommentus 2002.
Preterm To do this, it is of outmost importance to adjust the growth of a child born before term to the child biological age. The two latest version of Swedish growth chart have this tool. Justering 0-24 måm Hagenäs L & Gelander L. Kommentus 2002.

29
Catch up + 2.0 SD There are many other known normal growth patterns. The child with tall parents often accelerates in height during the fist 3 months after and then grows more parallel to target height SDS. - 1.0 SD 0-24 mån

30
Luo ZC et al. Epidemiology. 2003 Jan;14(1):65-73
:65-73")
31
Adaptation - 0.7 SD + 2.5 SD 0-24 mths
Another pattern is the child born large to shorter parents. It usually takes the first year to climb down to taget height SDS. 0-24 mths

32
Stopped breastfeeding
What about weight then? I have focused on height, since a child should have a certain weight in relation to height. Here you can see growth of a child breastfed until 10 months of age. There is clearly an impact on weight by feeding. And can it be normal for the child to lose weight after cessation of breastfeeding? In this case – yes! Because she has outgrown her parents and thus is expected to grow closer to – 1 SD in the long term run. Without information about target height-SD it is not possible to evaluate this growth as normal.

33
Classification of normality?
But how shall we include breastfed children in the chart? Shall we select those who manage breastfeeding like this girl’s mother, until she was 10 months? Or is 4 months what we decide to be the normal pattern? Or 2 months? The weight reference will be different related to which feeding pattern we decide as the right and normal one and most children who are not fed like this will look abnormal when plotted on the chart. 10 months? 4 months? 2 months?

34
95% ± 2SD

35
Gelander L. Torslanda study, unpublished
Children age 5.5 years - 2 SD 0 SD + 2 SD Svält? Fetma So if the try to establish what weight a healthy child should have, let us look at these 5½ year old children. Children with height at – 2 SD will have weight related to height, but will not in SD scores be as light. In this Swedish population there is a subpopulation of children with probable starvation. You can compare with the weight of children at average height and those tall children at + 2 SD. Here it seems as there are increasing subpopulations of children suffering from adiposity. Gelander L. Torslanda study, unpublished

36
Gelander L et al. Läkartidningen. 2002 Jan 17;99(3):162-4.
Lou ZC et al. J Pediatr Endocrinol Metab Jun;14(6): Gelander L et al. Läkartidningen Jan 17;99(3):162-4.
: Gelander L et al. Läkartidningen Jan 17;99(3):")
37
Conclusion Population growth should be monitored
Health care needs idealized growth charts Biological age Height related to parents Weight related to height Possibility to include growth patterns Feeding Tempo of maturation Early adaptation

38
Population health Secular trends Trends in health risks Height Puberty
Obesity Starvation Stunting

39
Gelander L. Torslanda study, unpublished
Subpopulation? SW US ± 2SD Gelander L. Torslanda study, unpublished

40
Estrogen Growth hormone Insulin-like growth factor I
Sex hormones Estrogen Androgens Growth hormone IGF-I, thyroid hormone, cortisone Insulin-like growth factor I Karlberg J & Albertsson-Wikland K. Acta Paediatr Scand May;77(3):
:")
41
Gelander L. Torslanda study, unpublished
Subpopulation US SW Gelander L. Torslanda study, unpublished

44
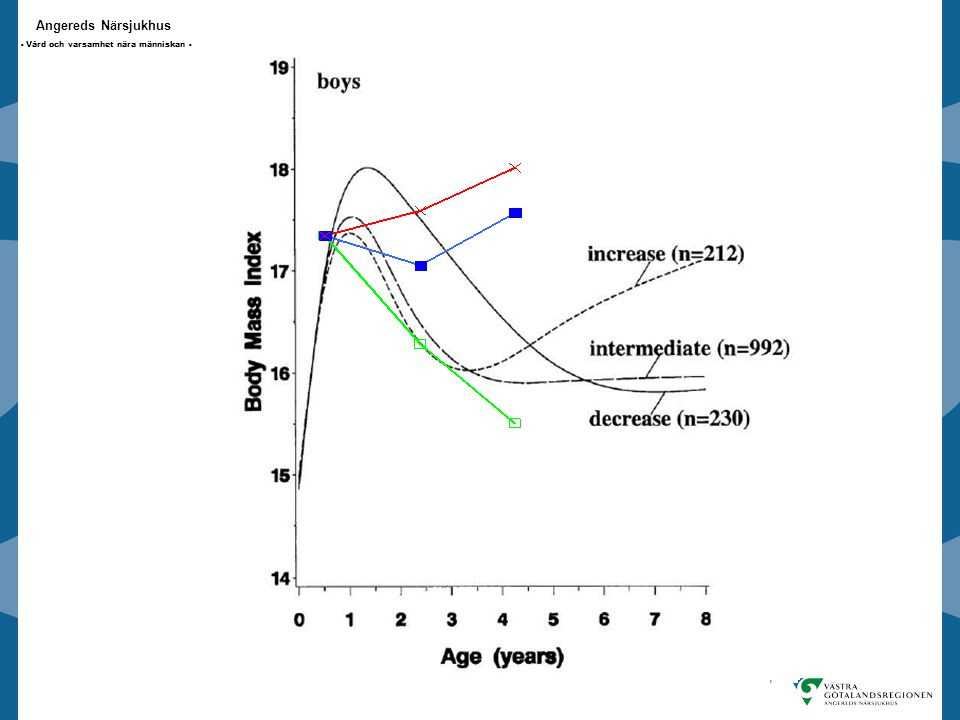
Reinehr T et al. American Journal of Clinical Nutrition, Vol. 91, No
Reinehr T et al. American Journal of Clinical Nutrition, Vol. 91, No. 5, , May 2010

Liknande presentationer