Ladda ner presentationen
Presentation laddar. Vänta.

1
Havets nåvåförändringar observationsfakta mot IPCC-modeller
Nils-Axel Mörner Paleogeophysics & Geodynamics, Stockholm, Sweden President INQUA Com. on Sea Level Changes and Coastal Evolution ( ) Leader of the Maldives Sea Level Project ( ) Co-ordinator INTAS project on Geomagnetism and Climate ( ) The Golden Condrite of Merit, 2008, Algarve University: “for his contribution to our understanding of sea level change”
 Leader of the Maldives Sea Level Project ( ) Co-ordinator INTAS project on Geomagnetism and Climate ( ) The Golden Condrite of Merit, 2008, Algarve University: for his contribution to our understanding of sea level change")
2
Förändringar har Fördelar och Nackdelar Det enda Verkliga Hotet
det gäller i högsta grad för Global Warming Men inget gott kan komma från en snabb stigning av havsytan Därför ar detta Det enda Verkliga Hotet Fast i sanning, Så Helt Fel ! quod erat demonstrandum

3
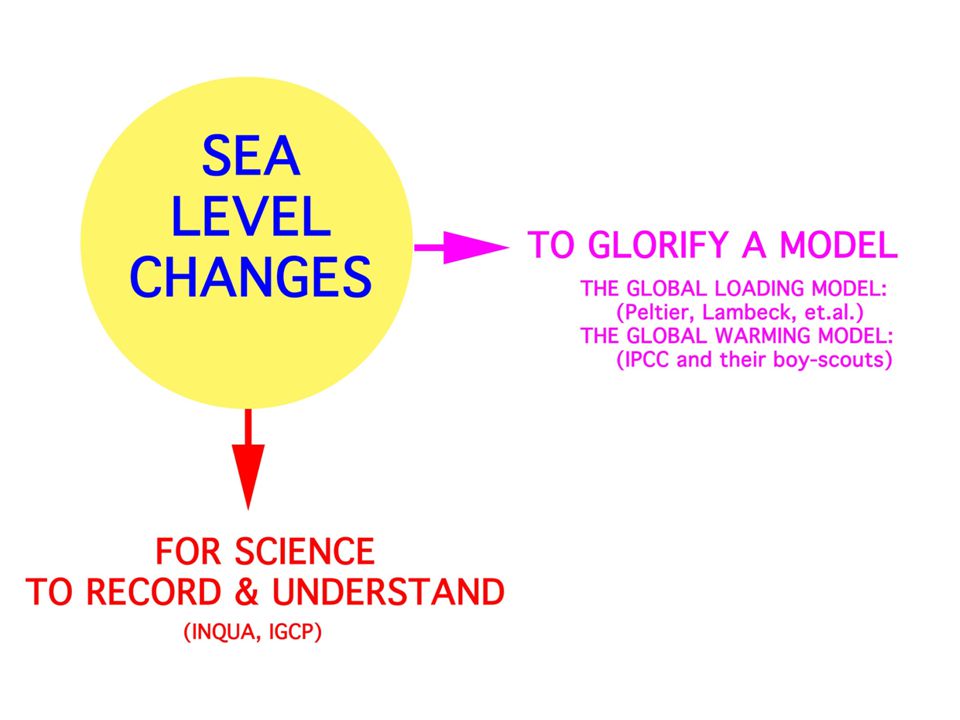
Det är det här det handlar om Observationsfakta eller Modeldata

4
maximal isavsmältning
1. maximal isavsmältning och global sea level

5
De glaciärer som finns idag kan aldrig smälta fortare än istidens enorma ismassor
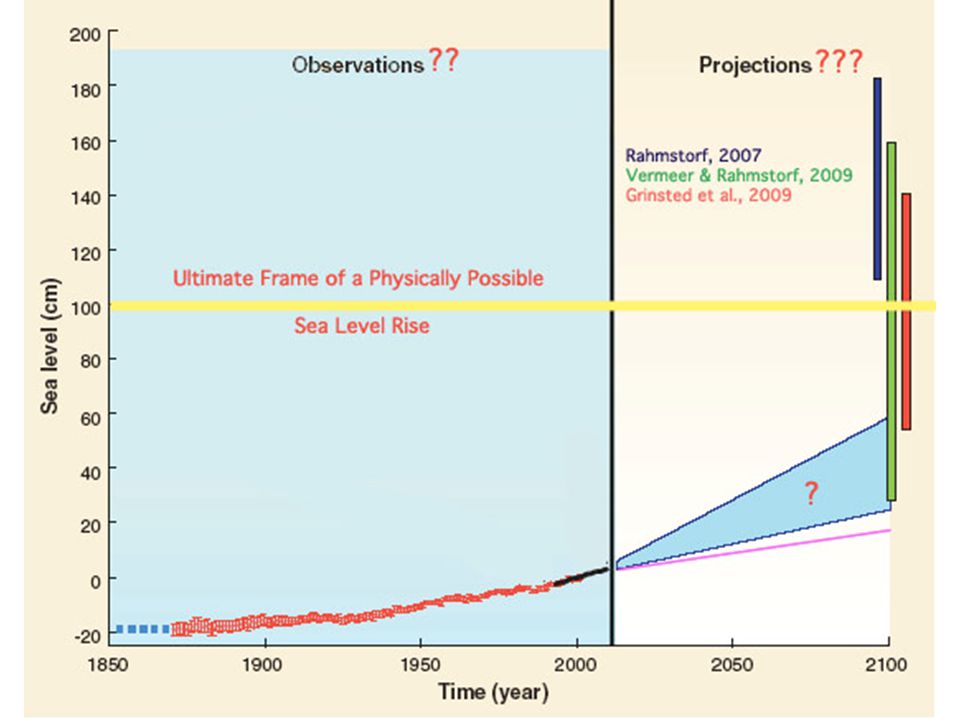
Smältningen av istidens glaciärer tog 10,000 år Och havsytan steg då med 10 mm/år (1 m/100 år) Vilket sätter en yttersta gräns för en möjlig havsytestigning idag
 Vilket sätter en yttersta gräns för en möjlig havsytestigning idag.")
6
The rate of glacial eustatic rise after LGM was ~10 mm/yr and sets the ultimate limit of possible sea level changes in the present century (yellow).
.")
7
IPCC is coming down with time !
COMPARE: Mörner, 1991 ~0.0 Mörner, 1996 <+10 cm INQUA, 2000 +10 ±10 cm Mörner, 2004 +5 ±15 cm Mörner, 2010 +5–7 ±10 cm

9
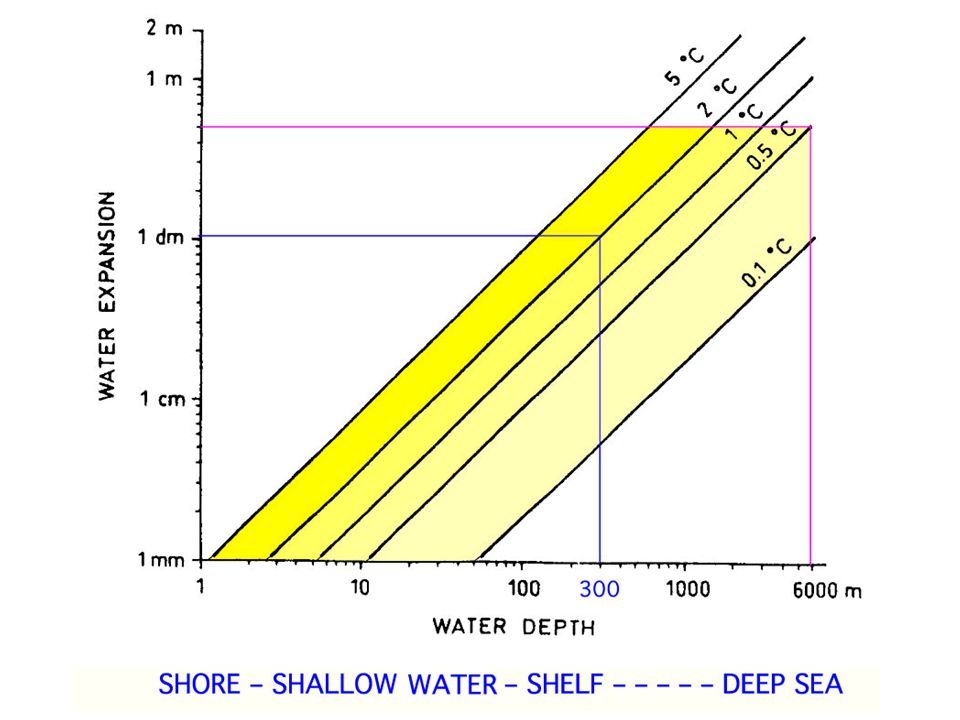
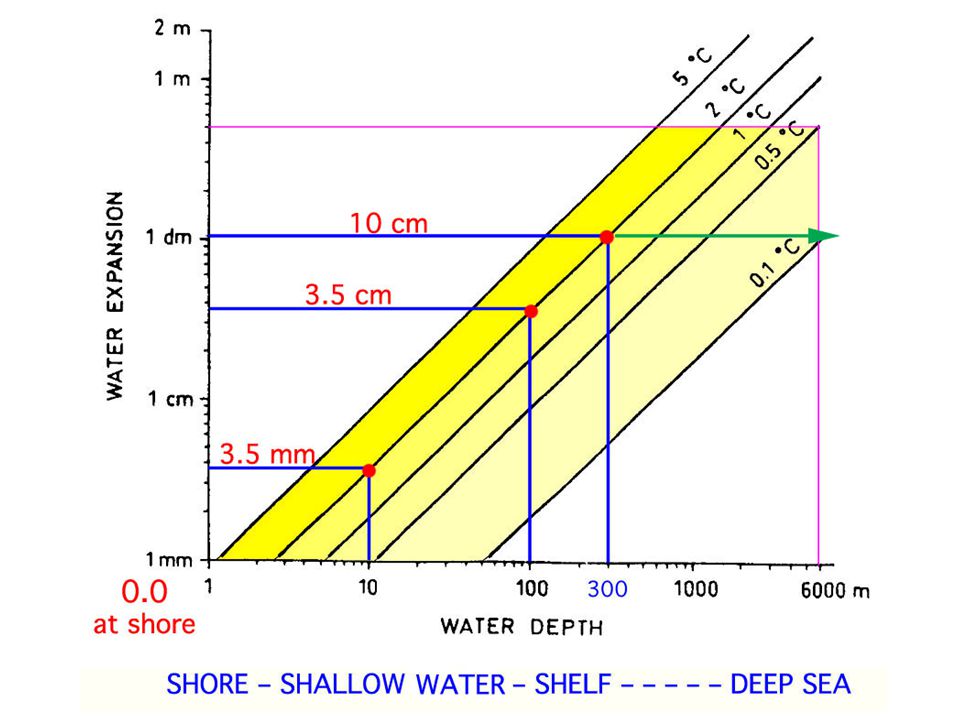
2. Thermal Expansion

12
3. Sea Level Changes

13
Numerous interacting factors control the stability of the shoreline
OBSERVATIONAL FACTS Numerous interacting factors control the stability of the shoreline

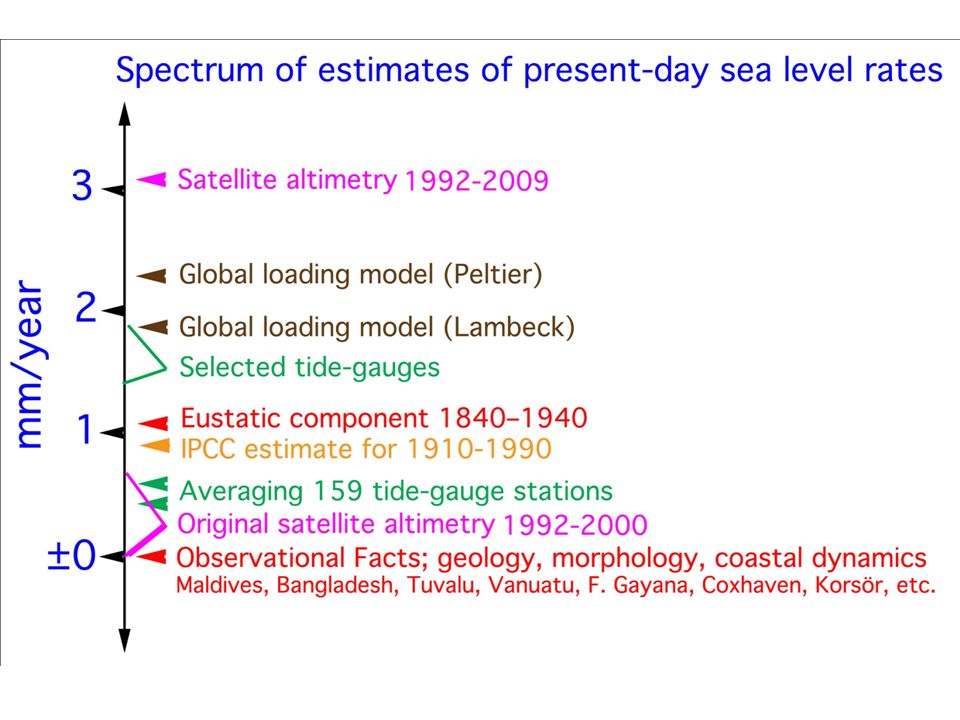
15
It shows variations – ups and downs – but no trend.
The combined observational records (in mm/year) for the last 300 years. It shows variations – ups and downs – but no trend. For year 2100, INQUA gives predictions in line with this record, whilst the IPCC scenarios lie far above – way off – observational data
 for the last 300 years. It shows variations – ups and downs – but no trend. For year 2100, INQUA gives predictions in line with this record, whilst the IPCC scenarios lie far above – way off – observational data.")
17
4. Nature’s own observational records

18
Dömd att översvämmas om 50-100 år
5. The Maldives Dömd att översvämmas om år

19
The new sea level curve of the Maldives recording a seven oscillations driven by the redistribution of ocean water masses (from Mörner, 2007)
")
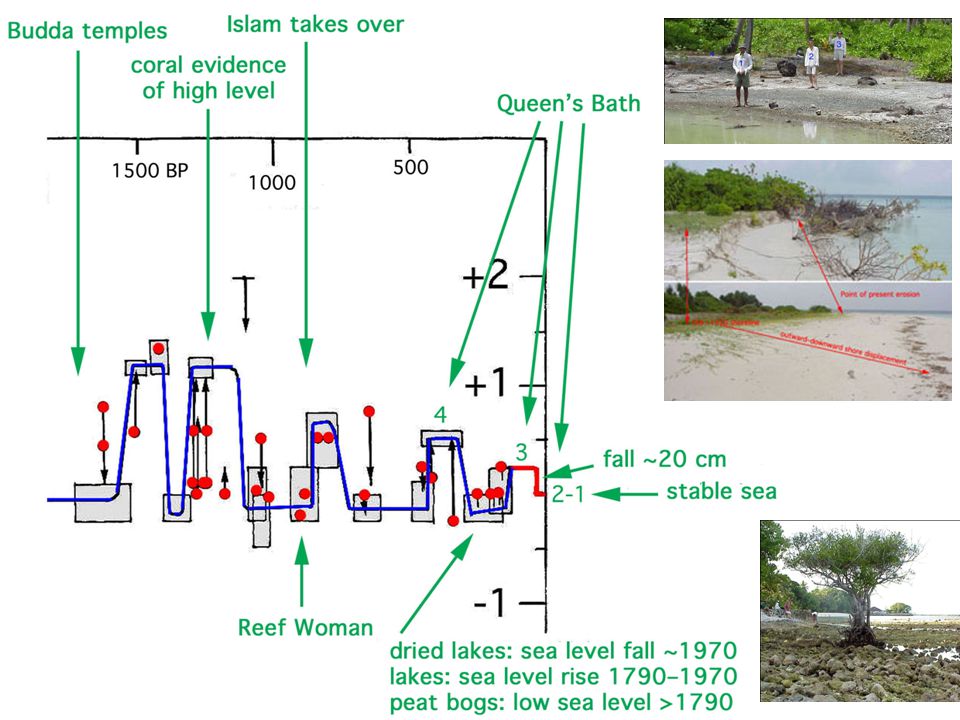
20
Fen-to-lake records on the island of Goidhoo
~1970 1790 ~1700

21
Queen’s Bath (4) +0.6 m ~400 BP (3) +20-30 cm >1970 (2) Present HTL
(1) Present MTL
 Present MTL.")
22
At ~1970 Sea Level fell some 20 cm Causing erosion
with sand deposition outward, downward Leaving an old fossil shore and an old overgrewing surface of grey weathered corals. The present shore has remained stable for ~30 years The two laked on Goudhoo dried up

23
Shore on map from 1922 Platform >1970 Platform >1970 Fall ~1970 Platform <1970

25
Sea level changes in the Maldives from 1500 to 2009 and 2100
No reasons for any alarm Sea level has been stable for the last 30 years Maximum future change may be a return to a pre-1970 level

26
Past-Present-Future sea level changes no threat at all !
Cabinet under water President in water Past-Present-Future sea level changes no threat at all !

27
6. Bangladesh an area cursed by repeated flooding and doomed to experience terrible flooding disasters in the near future

28
Coastal Erosion ! Sea is Rising !
The IPCCers say

29
men – ingen havsytestigning
kusterosion – ja men – ingen havsytestigning vilket klart framgår av trädens rötter som sprider sig horisontellt på precis samma nivå som i skogen bakom

31
The original clay surface was just above the horizontal roots

33
The wreck is stranded at HTL with a storm beach behind.
This suggests a slight lowering with respect to the delta surface

34
Sea Level Changes in Bangladesh
There is no global sea level rise in Bangladesh

36
INDIA BANGLADESH MALDIVES

37
7. Tuvalu and Vanuatu Both island-groups claimed already to be in the process of becoming flooded

38
Tuvalu – tide gauge record
8 years of slow rise (installation subsidence?) is followed by years of stability – i.e. no sea level rise the 3 low levels represent ENSO-events
 is followed by 22 years of stability – i.e. no sea level rise the 3 low levels represent ENSO-events.")
39
Vanuatu, another notorious site of ”flooding”,
The Vanuatu News Port Vila Press Online, December 2005 declaired that ”a small community living on Vanuatu has had to be formally moved out of harms” as an effect of the proposed sea level rise and flooding concept. Vanuatu, another notorious site of ”flooding”, shows, in fact, no sign of any ongoing sea level rise

40
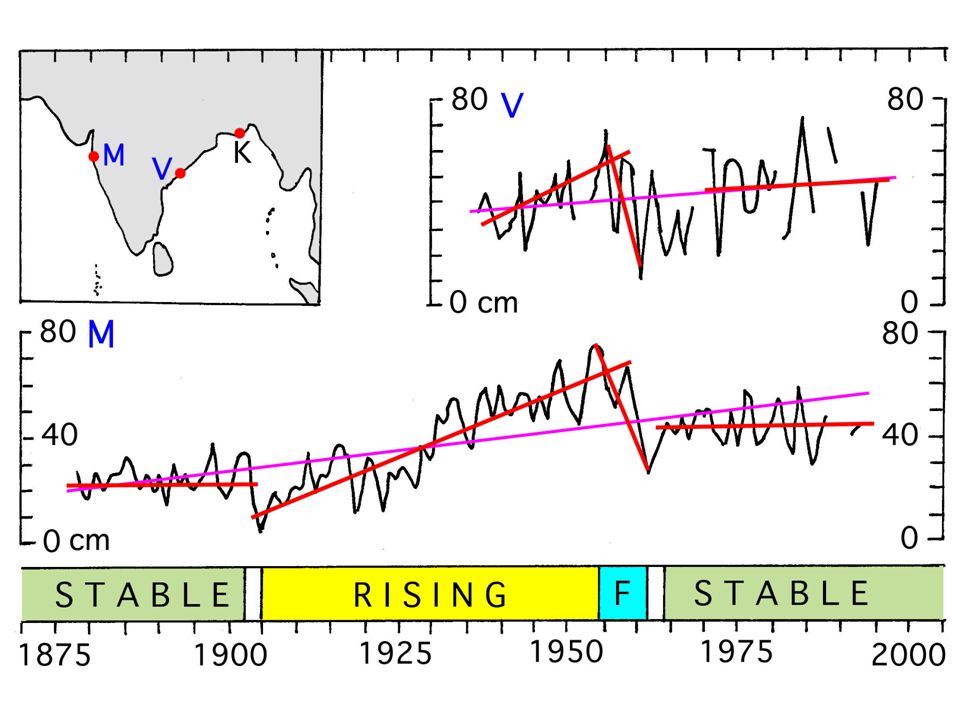
Venice - a good test site
8 Venice - a good test site Located in the slowly subsiding Po delta any sea level rise or acceleration would be easily detected

41
Sea level (pink) fluctuated around this line from 1870 to 1970.
Venice, built on delta deposits, experiences a long-term subsidence (blue line). Sea level (pink) fluctuated around this line from 1870 to 1970. No eustatic sea level rise is seen, and from 1970 there even is a sea level lowering recorded
. Sea level (pink) fluctuated around this line from 1870 to No eustatic sea level rise is seen, and from 1970 there even is a sea level lowering recorded.")
42
9. North-west Europe land subsidence long the North Sea coasts and the periphery of uplift in the Kategatt Sea

43
Korsör Coxhaven Amsterdam

44
Eustatic curve 1680-1970 (för NW Europa)
")
45
From 1840 t sea level rose by 11 cm – blue line the Earth’s rate of rotation (LOD) ≈ 10 cm – green line
 ≈ 10 cm – green line")
46
COXAHVEN 160 YEARS TIDE-GAUGE RECORD
A mean-sinosidal relative sea level rise is composed of a long-term subsidence (red) of ~1.4 mm/year and a sinosoidal eustatic rise up to 1960 followed by a slight lowering
 of ~1.4 mm/year and a sinosoidal eustatic rise up to 1960 followed by a slight lowering.")
47
Korsör ligger på nollpunkten för landhöjningen undersenaste 8000 åren
Korsör ligger på nollpunkten för landhöjningen undersenaste 8000 åren. Här skulle sann eustasy råda (that is, if the instrument is stably located, which is not at all certain) Vad ser vi? antingen 7,5 cm stigning (svart linje) eller en segmenterad utan trend (red) ingem acceleration I sent tid (snarare motsatsen)
 Vad ser vi antingen 7,5 cm stigning (svart linje) eller en segmenterad utan trend (red) ingem acceleration I sent tid (snarare motsatsen)")
48
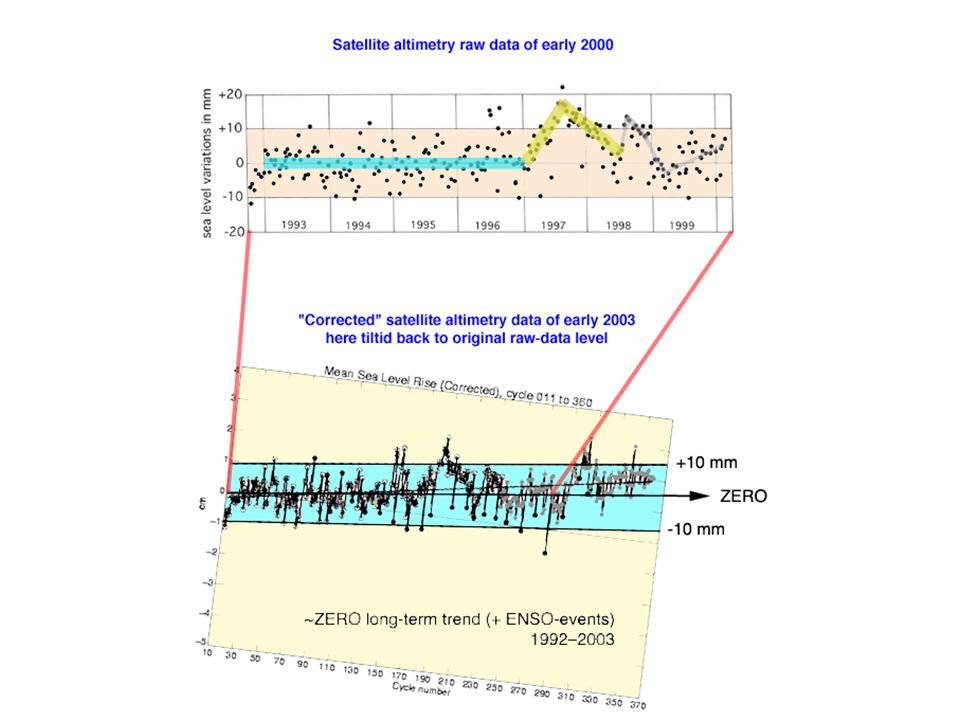
10. Satellite Altimetry A wonderful new tool to measure the ocean level but from where does the tilt come?

49
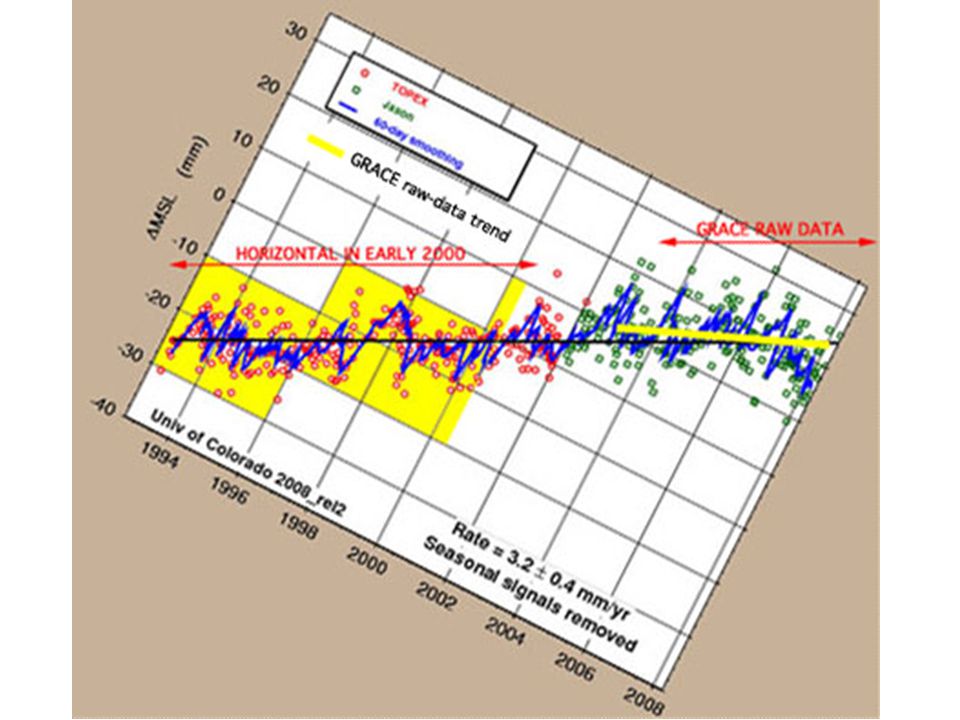
Satellite altimetry – after all physical corrections – showed
In 2000 Satellite altimetry – after all physical corrections – showed NO rising trend Just a variability around a zero level (blue) + a major ENSO event (yellow). This data set was presented on the TOPEX/POSEIDON web-page, in their publications, and used by me in my paper in Global and Planetary Changes, vol. 40, 2004, p
 + a major ENSO event (yellow). This data set was presented on the TOPEX/POSEIDON web-page, in their publications, and used by me in my paper in Global and Planetary Changes, vol. 40, 2004, p")
50
In 2003 a totally new record appeared
Now there was a trend of 2.3 mm/year. This trend is inferrend – not measured

52
Satellite Altimetry

53
-0.12 ±0.06 mm/yr ––– +1.9 ±0.9 mm/ye

54
Satellit kartan stämmer inte med faktiska platsobservationen !

56
Satellite Altimetry

57
50 havsytedata från French Guiana-Surinam
±0 eller +3 50 havsytedata från French Guiana-Surinam Den visar en klar dominans för the 18.6 years tidal cycle runt en stabil noll-nivå Satellite altimitry ger en stigning på ~3 mm/år Det finns ett klart budskap i den skillnaden ! Ett värde måste vara fel och det kan ju inte vara observationen.

58
för att havet INTE stiger – förstås
Om havet skulle stiga snabbt, så skulle Jorden – enligt lage om vridmomen – uppvisa en deceleration (nerbromsning) Så är INTE fallet – Varför det? för att havet INTE stiger – förstås
 Så är INTE fallet – Varför det för att havet INTE stiger – förstås.")
59
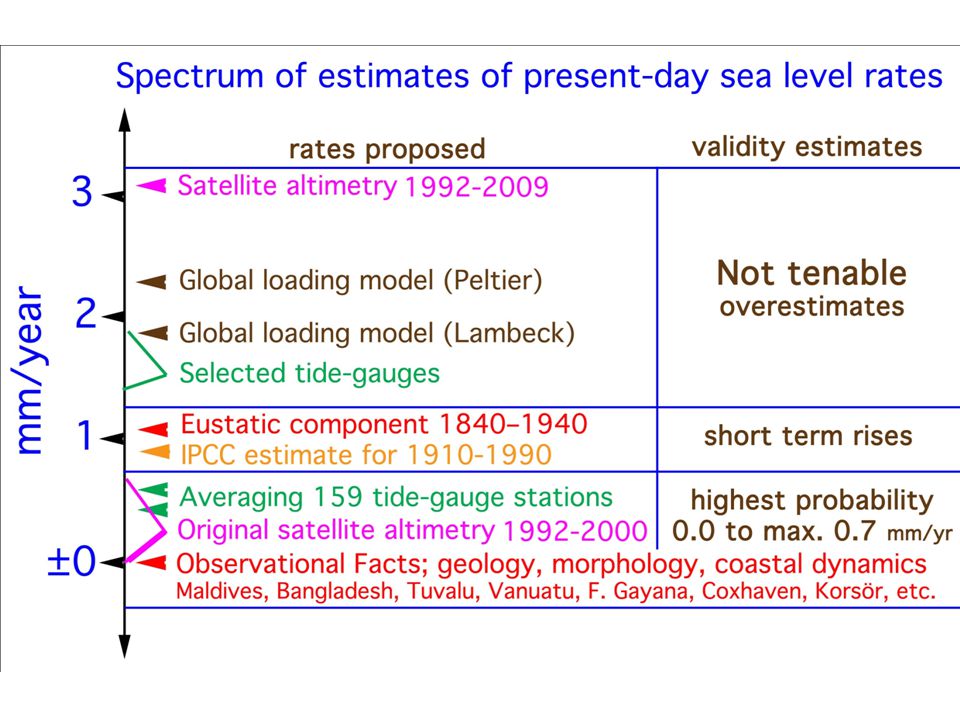
CONCLUSIONS No sea level rise recorded: – in the Maldives – in Tuvalu – in Vanuatu – in Bangladesh – in French Guiana – in Venice – in NW Europe Thermal expansion – is small <10 cm – zero at shore Satellite Altimetry – records no or just a small rise

61
CONCLUSIONS. the observational records (curve A) is correct
CONCLUSIONS the observational records (curve A) is correct the IPCC models (curves B-C) are wrong
 is correct the IPCC models (curves B-C) are wrong.")
62
+5 cm ±15 cm

63
utan ett översvämningsscenario
finns det inte mycket hot kvar i IPCC tigern har tappat sina tänder kanske det aldrig var någon riktig tiger bara en uppblåst balongdocka

64
The Greatest Lie Ever Told
about 200 peer-reviewed papers on Sea Level & Climate Mörner, N.-A., 2007 The Greatest Lie Ever Told 1st ed, 2007, 2nd ed. 2009, 3rd in 2010, 20 pp. säljes för 10 Euro eller 8 NOK

65
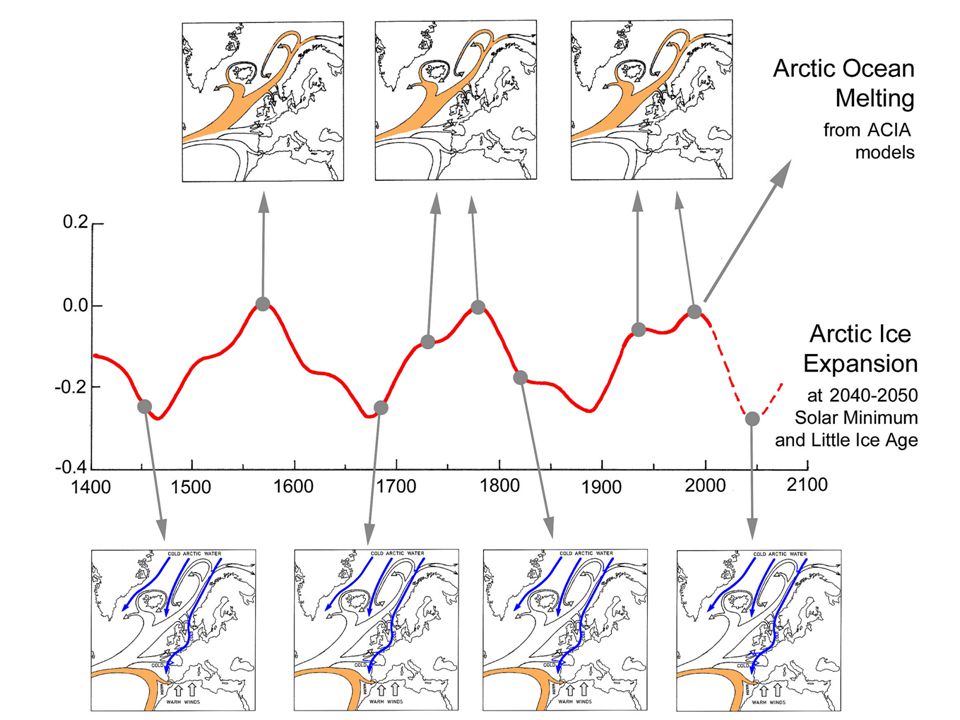
och vart är vi på väg? mot en Varmare Jord (som IPCC påstår) eller mot en Kallare Jord (som Solen anger)
 eller mot en Kallare Jord (som Solen anger)")
66
The Gulf Stream The Gulf Stream at Solar Maxima (left)
with Earth deceleration The Gulf Stream at Solar Minima (right) with Earth acceleration
 with Earth acceleration.")
68
Sunspot low – Solar Minimum Little Ice Age climate condition
Abdassamatov, 2010 Sunspot low – Solar Minimum Little Ice Age climate condition

69
SOLAR Minimum and Little Ice Age conditions by year 2040

70
Don’t worry, my son, the present is a reflection of the past nothing more, nothing less – just the same old story

71
och äntligen nära The End

73
Det är så mycket lögner och överdrifter kopplade till “Global Warming”
Människor kan uppföra sig så men träd ljuger inte ! The Maldives Bangladesh

74
The Maldives the tree has a delicate position (at least since the 1940s) the slightest sea level rise would have destroyed it This indicates: No Sea Level Rise in 50 years Bangladesh The tree trunks indicate a significant coastal erosion The horizontal roots indicate the same growth level as in the forest behind This indicates: No Sea Level Rise !

75
sniffar, observerar, dokumenterar
Vi ljuger inte heller sniffar, observerar, dokumenterar

76
samma gamla historia – lite upp och lite ner men absolut ingen Global Översvämning och självfallet aldrig i Oslo med stark landhöjning

Liknande presentationer


>")


![DANIEL STEINHOLTZ, WWW.ALLIES.SE. ”FRANKLY, WE NEED A REVOLUTION…” [ MAURICE STRONG AT STOCKHOLM +40 ]](/8/2534147/big_thumb.jpg "DANIEL STEINHOLTZ, WWW.ALLIES.SE. ”FRANKLY, WE NEED A REVOLUTION…” [ MAURICE STRONG AT STOCKHOLM +40 ]>")


